Scaling Sequence-to-Omics Models
Exploratory experiments on dataset breadth, parameter count, track diversity, and transformer depth in sequence-to-omics models.
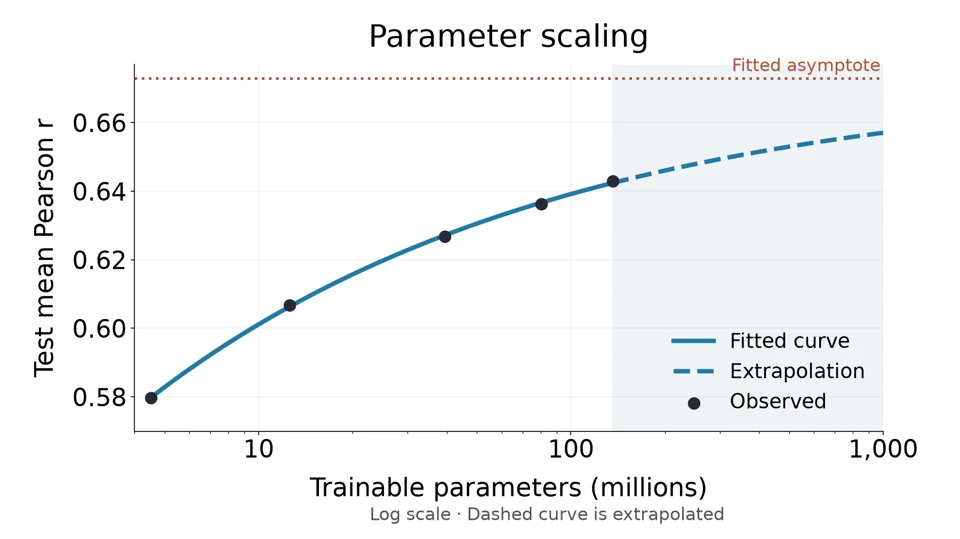
Scaling Dataset Breadth
To evaluate how accuracy scales with dataset breadth, I ran five training experiments, each exposed to a different number of randomly selected sequence windows from the Enformer/Basenji2 dataset (1–5). All experiments ran for 10,000 steps. Both human and mouse tracks were used. A basic CNN + Transformer architecture was used.
Here are the results:
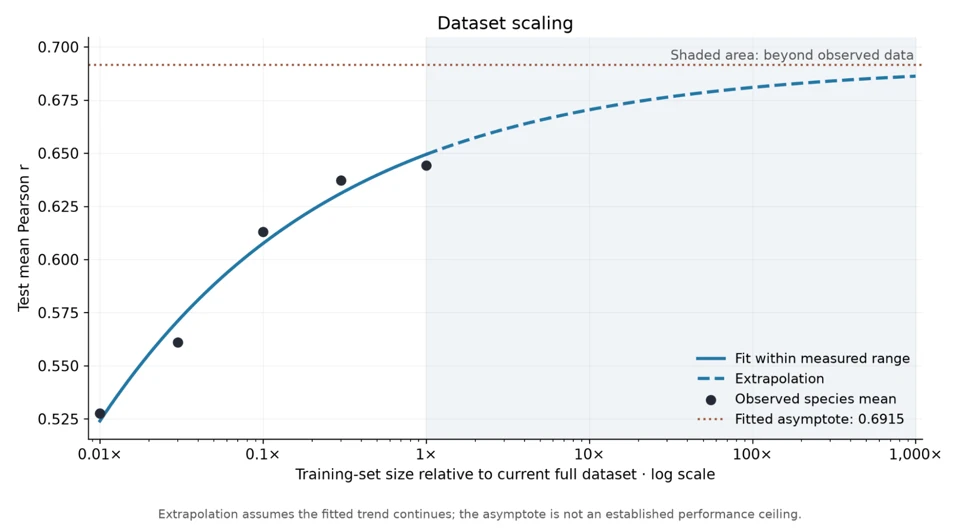
Here is the training fraction (0.01–1.00). In-sample RMSE: 0.006473 Pearson units.
| Proportion | Paired examples | Unique human windows | Unique mouse windows | Human test Pearson | Mouse test Pearson | Mean test Pearson |
|---|---|---|---|---|---|---|
| 1% | 340 | 340 | 340 | 0.488453 | 0.566707 | 0.527580 |
| 3% | 1,021 | 1,021 | 1,017 | 0.524498 | 0.597414 | 0.560956 |
| 10% | 3,402 | 3,402 | 3,350 | 0.567636 | 0.658549 | 0.613093 |
| 30% | 10,206 | 10,206 | 9,792 | 0.588144 | 0.686380 | 0.637262 |
| 100% | 34,021 | 34,021 | 29,295 | 0.593640 | 0.694865 | 0.644252 |
These results suggest that simply training on more sequence windows from these datasets yields diminishing improvements under the same training budget. Increasing the training subset from 30% to 100% improved mean test Pearson by 0.007. With a fixed batch size, larger datasets receive fewer passes through their examples at the same step budget. The flattening could therefore reflect limited training rather than an architectural limit; the five-point fit does not distinguish these explanations.
It’s tempting to hypothesize that data from other species might introduce useful new patterns. These experiments do not test that question. Still, evolutionary diversity could provide information that more windows from the same species do not, so this remains a very valid hypothesis to test.
Scaling Parameter Count
To evaluate how accuracy scales with model size, I ran five training experiments, each with varying parameter count. Notably, all models used just one transformer block (see why). All models had equal training steps under exactly the same dataset (Enformer/Basenji2) and random seed.
Here are the results:
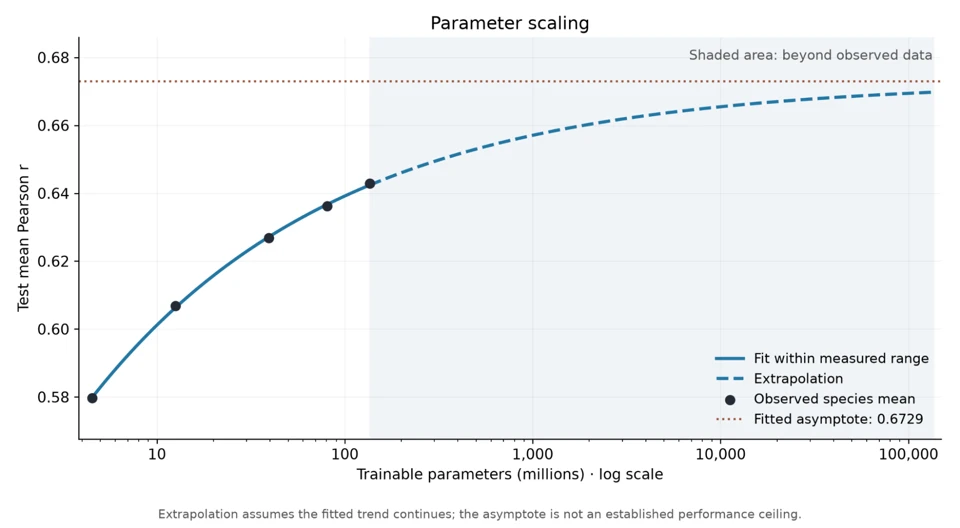
Here is the number of trainable parameters. In-sample RMSE: 0.000400 Pearson units.
| Model | Parameters | Human test Pearson | Mouse test Pearson | Mean test Pearson |
|---|---|---|---|---|
| tiny | 4,515,288 | 0.528962 | 0.630330 | 0.579646 |
| small | 12,571,768 | 0.556101 | 0.657543 | 0.606822 |
| medium | 39,402,936 | 0.576619 | 0.676999 | 0.626809 |
| large | 80,525,048 | 0.585248 | 0.687223 | 0.636236 |
| full | 135,938,104 | 0.591996 | 0.693784 | 0.642890 |
These results show a similar pattern to dataset scaling: larger models perform better, but the gains become smaller as parameter count increases. Increasing the model from 39.4 million to 135.9 million parameters (more than triple the size) improved mean test Pearson by 0.016. The fitted curve describes gains at this training budget, not a hard architectural limit. Larger models may need more training steps to converge, so these results do not establish how the models would compare after convergence.
Scaling Track Diversity
To evaluate how accuracy scales with track diversity, I ran another five training experiments, each exposed to a subset of randomly selected tracks from the Enformer/Basenji2 dataset. In performing these experiments, I sought to answer not only the scaling question, but also learn whether focus on specific tracks or data diversity across many tracks was more advantageous. In these runs, neither approach had a clear advantage: results on each subset were approximately the same between focused models and the all-track model.
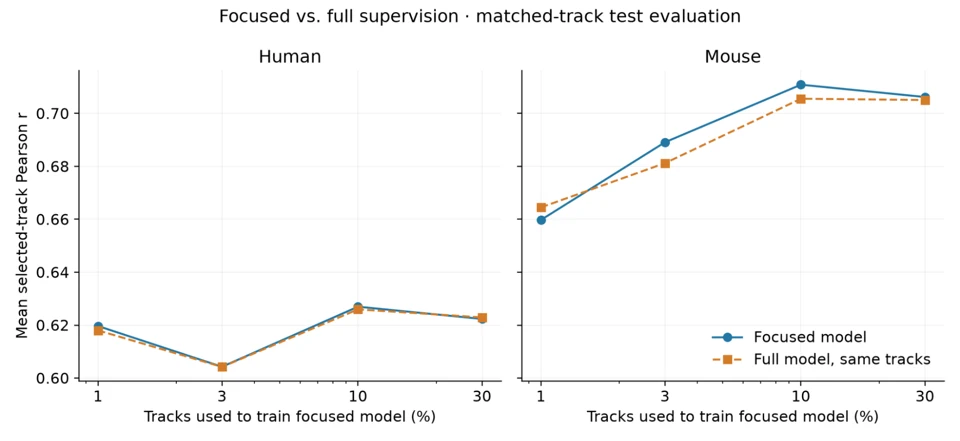
For each subset, both models were evaluated on exactly the same selected tracks. Pearson was calculated separately for each track across test examples and sequence bins, then averaged over tracks with defined correlations in both models.
| Track fraction | Species | Selected tracks | Focused Pearson | Full-model Pearson, same tracks | Δ focused − full |
|---|---|---|---|---|---|
| 1% | Human | 53 | 0.619670 | 0.618029 | +0.001640 |
| 1% | Mouse | 16 | 0.659757 | 0.664492 | -0.004735 |
| 3% | Human | 159 | 0.604273 | 0.604211 | +0.000062 |
| 3% | Mouse | 49 | 0.689113 | 0.681215 | +0.007898 |
| 10% | Human | 531 | 0.626970 | 0.625954 | +0.001015 |
| 10% | Mouse | 164 | 0.710858 | 0.705554 | +0.005304 |
| 30% | Human | 1594 | 0.622344 | 0.622931 | -0.000587 |
| 30% | Mouse | 493 | 0.706207 | 0.705071 | +0.001136 |
These results suggest that more tracks do not necessarily lead to better predictions on a given subset. Whether additional supervision helps may depend on which tracks are added.
One limitation is that I only ran one trial per subset size. Ideally, I would have repeated these experiments, especially for smaller subsets like 1%, but compute limitations prevented this. Still, the differences in this trial were small and did not consistently favor either approach.
Comparing Transformer Depth
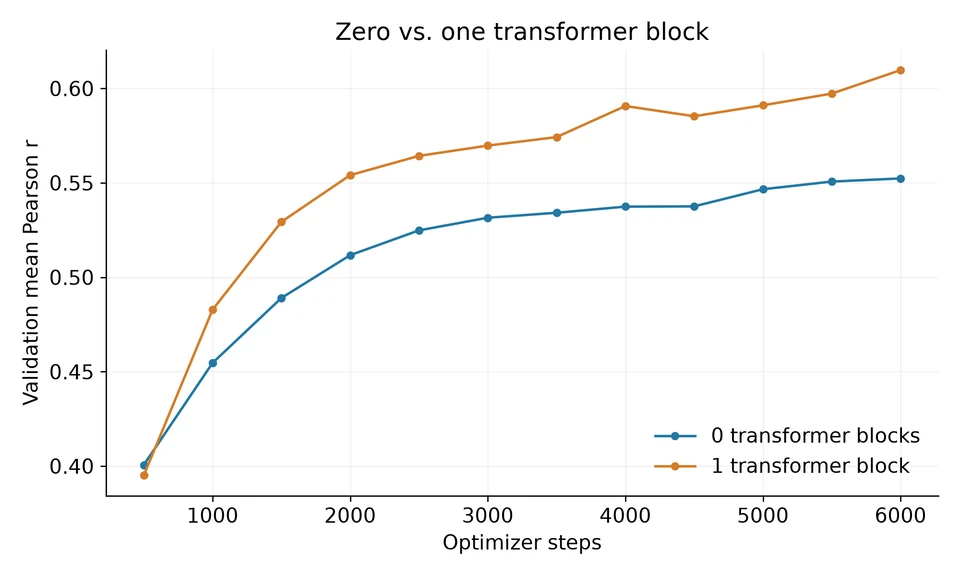
In my testing, I saw a very clear increase in validation performance at matched training steps between a model with zero transformer blocks and a model with just one:
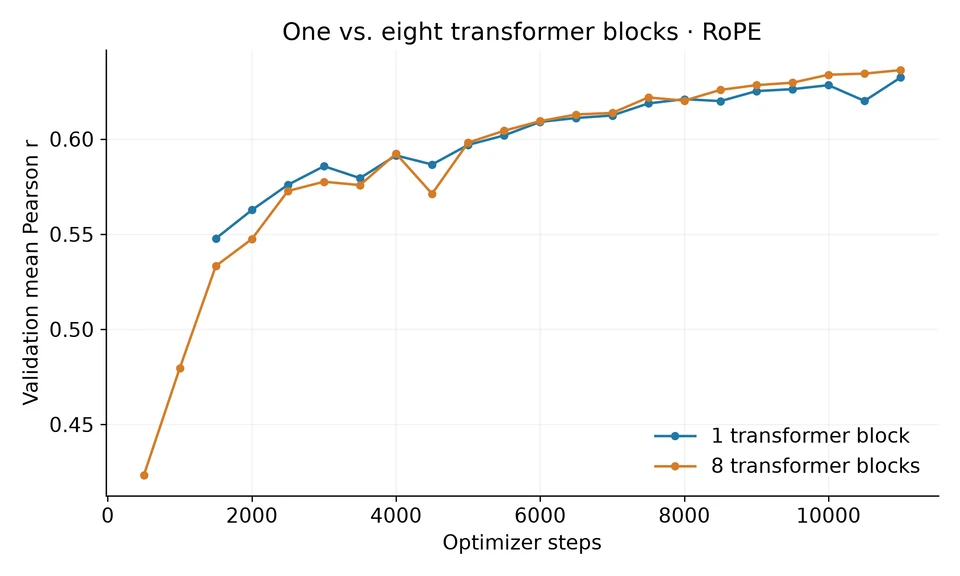
However, going past one transformer block did not improve performance dramatically:
Data Summary:
| Positional encoding | Blocks | Matched step | Human validation Pearson | Mouse validation Pearson | Mean validation Pearson |
|---|---|---|---|---|---|
| Original | 0 | 6,000 | 0.499523 | 0.605167 | 0.552345 |
| Original | 1 | 6,000 | 0.560605 | 0.658851 | 0.609728 |
| Original | 8 | 6,000 | 0.551344 | 0.651899 | 0.601622 |
| RoPE | 1 | 6,000 | 0.560593 | 0.657451 | 0.609022 |
| RoPE | 8 | 6,000 | 0.560375 | 0.658521 | 0.609448 |
| RoPE | 1 | 11,000 | 0.581557 | 0.683154 | 0.632356 |
| RoPE | 8 | 11,000 | 0.584142 | 0.688364 | 0.636253 |
To explore how much each transformer block changes its input, I perform a simple analysis of three common S2O models: Enformer (1), Borzoi (6), and AlphaGenome (8). For each block, I measure the cosine similarity between its input and output feature vectors at each sequence position, then average across positions and eight genomic sequences. Lower similarity means that the block changes the direction of these vectors more, while higher similarity means that their direction remains largely unchanged.
Here are the results:
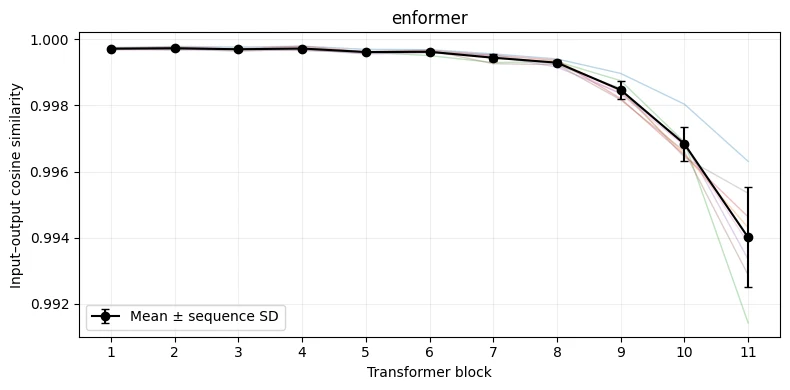
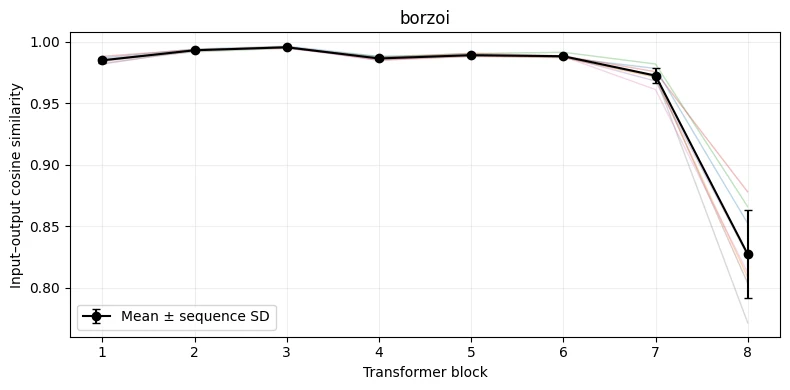
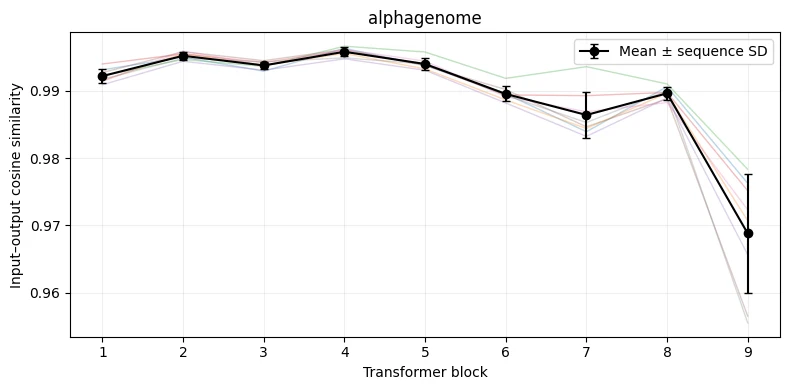
Across all three models, the largest changes to the input representations tend to occur in the final transformer blocks, while earlier blocks make smaller changes. It is important to note that these measurements describe representation changes but do not establish whether individual blocks can be removed without affecting predictions. Separately, in the custom-model depth comparison, one and eight transformer blocks achieved similar validation Pearson scores at matched training steps. That result suggests a limited benefit from additional depth under the tested conditions, but does not fully establish that transformer blocks in Enformer, Borzoi, or AlphaGenome are redundant.
Direct block ablations, with and without fine-tuning, would test whether pretrained models can retain performance with fewer blocks.
Methods
This is a very brief methods summary. Full details can be found in the repository code.
The custom model takes one-hot encoded DNA sequences of 131,072 bases as input. A multi-scale convolutional stem captures local sequence patterns, followed by six convolutional stages that progressively increase feature width and downsample the sequence to 128-base resolution. Six residual blocks with dilated convolutions provide broader sequence context, followed by one transformer block with 12 attention heads and a learned relative positional bias. The resulting features are cropped to the central 896 bins and passed through a pointwise projection and separate human and mouse output heads, which use Softplus activations to predict nonnegative signals for 5,313 human tracks and 1,643 mouse tracks. For parameter scaling, convolutional and transformer widths were varied together while layer counts and output dimensions remained fixed.
I trained models on human and mouse data from the Enformer/Basenji2 dataset, varying the fraction of training sequence windows, model width, or fraction of supervised tracks. Each configuration used one training seed. Within each sweep, models used matched training-step budgets, with validation and test splits held fixed. Dataset and parameter scaling were evaluated using test Pearson correlations, reported separately for each species and averaged equally across species. For track supervision, focused and full-track models were evaluated on exactly the same selected tracks, calculating Pearson correlation per track across pooled test examples and sequence bins before averaging over tracks with defined correlations in both models.
I fitted three-parameter power-law curves to the dataset and parameter scaling results using unweighted nonlinear least squares; their asymptotes are conditional extrapolations, not established performance ceilings. Transformer-depth comparisons varied the number of blocks and positional encoding, using validation Pearson correlations at matched training steps. Separately, I measured input–output cosine similarity for each transformer block in Enformer, Borzoi, and AlphaGenome across eight genomic sequences. This measures changes in representation direction, rather than whether a block is necessary. These exploratory experiments do not include repeated-seed uncertainty estimates or establish performance after training to convergence.
Conclusion
At the tested training-step budgets, adding more sequence windows or parameters improved performance, but with diminishing returns. Adding more tracks provided no consistent benefit, and a model with just one transformer block performed similarly to an eight-block model. These experiments are limited by the small number of runs and lack of repeated trials, so they do not establish universal limits for S2O models.
These results motivate further comparisons of training budgets and architectures, including training to convergence, repeated seeds, and checks against published Enformer and Basenji2 results. I invite others to challenge the assumptions behind current architectures and explore different ways to approach these problems. There is still a lot of room for progress, and I suspect some of the biggest improvements will come from ideas we have yet to try.
References
- Avsec, Ž. et al. Effective gene expression prediction from sequence by integrating long-range interactions. Nature Methods 18, 1196–1203 (2021). doi:10.1038/s41592-021-01252-x.
- Kelley, D. R. Cross-species regulatory sequence activity prediction. PLOS Computational Biology 16, e1008050 (2020). doi:10.1371/journal.pcbi.1008050.
- yangyz1230. space: HDF5-formatted human and mouse Basenji data. Hugging Face dataset release. Dataset and documentation (accessed September 30, 2026).
- Kelley, D. R. et al. Sequential regulatory activity prediction across chromosomes with convolutional neural networks. Genome Research 28, 739–750 (2018). doi:10.1101/gr.227819.117.
- Yang, Z., Zhu, J. & Su, B. SPACE: Your Genomic Profile Predictor is a Powerful DNA Foundation Model. Proceedings of the 42nd International Conference on Machine Learning (2025). Paper.
- Linder, J. et al. Predicting RNA-seq coverage from DNA sequence as a unifying model of gene regulation. Nature Genetics 57, 949–961 (2025). doi:10.1038/s41588-024-02053-6.
- Su, J. et al. RoFormer: Enhanced transformer with Rotary Position Embedding. Neurocomputing 568, 127063 (2024). doi:10.1016/j.neucom.2023.127063.
- Avsec, Ž. et al. Advancing regulatory variant effect prediction with AlphaGenome. Nature 649, 1206–1218 (2026). doi:10.1038/s41586-025-10014-0.